Different category of forest area in the state is as under

| Sr. No | Reserved Forest | Data Period | Protected Forest | Unclassed Forest | Total |
|---|---|---|---|---|---|
| 1 | 1991-92 | 13817.51 | 998.09 | 4563.71 | 19379.31 |
| 2 | 1992-93 | 13820.01 | 995.31 | 4577.15 | 19392.47 |
| 3 | 1993-94 | 13818.83 | 997.43 | 4576.76 | 19393.02 |
| 4 | 1994-95 | 13832.97 | 997.53 | 4575.26 | 19405.76 |
| 5 | 1995-96 | 13704.1 | 388.37 | 4775.81 | 18868.28 |
| 6 | 1996-97 | 13694.7 | 387.99 | 4732.45 | 18815.14 |
| 7 | 1997-98 | 13696.04 | 388.12 | 4746.21 | 18830.37 |
| 8 | 1998-99 | 13724.07 | 388.18 | 4721.21 | 18833.46 |
| 9 | 1999-2000 | 13903.77 | 395.96 | 4699.78 | 18999.51 |
| 10 | 2000-01 | 14155.18 | 394.85 | 4562.51 | 19112.54 |
| 11 | 2001-02 | 14180.03 | 377.02 | 4523.94 | 19080.99 |
| 12 | 2002-03 | 14098.74 | 378.22 | 4463.34 | 18940.30 |
| 13 | 2003-04 | 14099.33 | 378.22 | 4462.75 | 18940.3 |
| 14 | 2004-05 | 14067.02 | 696.08 | 4198.46 | 18961.56 |
| 15 | 2005-06 | 14122.18 | 478.93 | 4326.39 | 18927.50 |
| 16 | 2006-07 | 14131.15 | 476.73 | 4319.40 | 18927.28 |
Source : Gujarat Forest Statistic – 2007

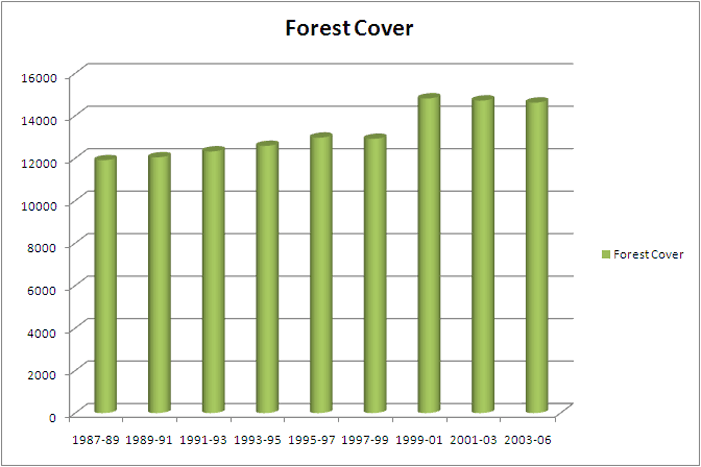
| Sr. No. | Assessment Year | Data Period | Forest Cover | Changes | Cumulative |
|---|---|---|---|---|---|
| 1 | 1991 | 1987-89 | 11907 | – | – |
| 2 | 1993 | 1989-91 | 12044 | (+)137 | (+)137 |
| 3 | 1995 | 1991-93 | 12320 | (+)276 | (+)413 |
| 4 | 1997 | 1993-95 | 12578 | (+)258 | (+)671 |
| 5 | 1999 | 1995-97 | 12969 | (+)391 | (+)1062 |
| 6 | 2001 | 1997-99 | 12913 | (-) 56 | (+)1006 |
| 7 | 2003 | 1999-01 | 14814 | (+)1901 | (+)2907 |
| 8 | 2005 | 2001-03 | 14715 | (-)99 | (+)2808 |
| 9 | 2009 | 2003-06 | 14620 | (-)95 | (+)2713 |
Source : FSI Report – 2009